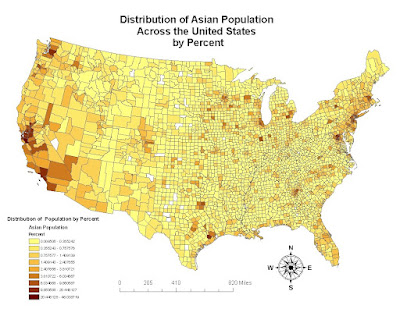
First, we have here a map of the distribution of the Asian population across the United States (by percentage, not by raw numbers). I have broken down the shadings into 9 different intervals, ranging from values between 0% and 46%. From looking at the map, we can see a clear clustering of the population along the coasts, east and west, but mainly the west. Also we can see the greatest clustering/concentration of the Asian population in the Bay Area California. The next few great populations are also around LA county and up in Washington state near Oregon. Also there is a high population on the east coast, and a surprising high concentration in Texas. We can also tell that there is a higher concentration around the cities and that the Midwest and the non-coastal states have very low populations of Asians. We could attribute the concentration on the coasts to either old immigration trends --people always come to the coast, the California railroad system used a great many number of Asian workers, or perhaps it is due to the more liberal makeup of the coasts.

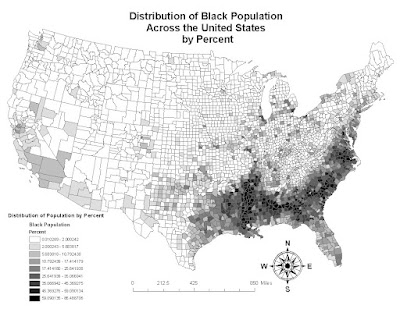
Now here is a map of the distribution of the Black population across the United States (by percentage, again). Again, I have broken down the percentage values into 9 intervals, ranging in values from 0% to 86%. We can see that this map is much different than the previous one. The majority concentrations are no longer on the coasts but mainly in the South. Also the only other place with the highest concentration of the population we can see is a small county in Michigan, which may indeed be Detroit. We can see the concentration pan out from the south, with the heart of the concentration in the middle of south panning out, until by the time we reach the Midwest and until we hit California, the population is at the lowest possible range, with no variance (not like the Asian map). We can perhaps attribute the concentration of the population in the South to the fact that the majority of African - Americans arrived in this country because of the slave trade which put them on plantations and the like in the South. Though we have moved past this, it is interesting to see that the concentration remains mainly in the original area, and in fact creates a fairly exact outline of the Confederate states.

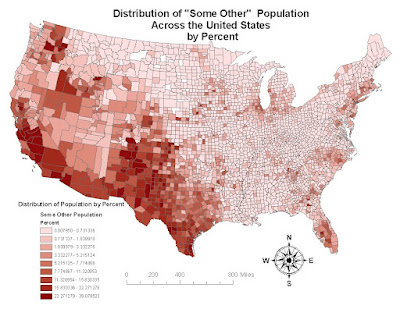
And finally here, we have a map of the distributions of "some other" population by percentage across the country, again divided into 9 intervals, this time ranging from values between 0% and 39%. This time we can see that the concentration of the population is in the west coast and doesn't really go out further past Texas. We can see here that the greatest percentages are in the central valley of California, as well as in Texas and New Mexico which leads me to believe that this "some other" population is Hispanic or Latino. Many Latinos have immigrated to the US in hopes of a better life and often end up working menial jobs for hours on end, often picking fruit and vegetables in the central valley, the main evidence for my hypothesis. Also, the fact that there is a great concentration of the population along the South-west border of the country (which borders Mexico) is another reason why I reached my hypothesis.
So in all, after the creation and analysis of these maps, it's very interesting, and fairly easy to see how perhaps historical, economic, and immigration factors have influenced the distribution of the Asian, Black and "other" (Latino/Hispanic) population across the United States. In all three cases we can see how these populations originally came into the country (and not under the best circumstances either)- to the west coast cities, the South, and to the West in general. Also we can see that even since their arrival, the most concentrated areas of their population have not moved far. The results leave much more to be investigated and asked, but gives a good starting point for inquiries into the spread of the population, wonder if the 2010 census will look much different!
GIS is indeed a useful tool and I am glad to be at least partially aware of how much power it is capable of and how easy it is to manipulate the data, which can indeed be misleading or eyeopening. For example, the results would be similar but skewed if we based the maps on raw population rather than percent, especially given the different populations of counties. The software that we used for this class, ArcGIS, however was quite difficult to maneuver and I feel like it takes a great deal of training and practice to master it. And so, GIS is indeed a great tool despite the technical difficulties, and is a great skill that helps transform raw data into understandable visuals that can teach us a great deal.
No comments:
Post a Comment